It took me a while to get
comfortable with standard deviation. Even though it was explained to us thoroughly
during Green Belt and Black Belt training, I used it without really understanding
what was behind it.
The big epiphany came while
working for my Black Belt exam and getting my hands on Six Sigma for Dummies. It
was the most brilliant explanation for it and I was glad to share it with my
new team as we prepared our upcoming Green Belt training. Let me share it with
you.
The standard deviation is the
average distance between your mean and your data points. I know. That sounds
almost too easy, but that is literally what the formula is. Let’s look into it
in details.
Let’s take pizza delivery as an
example. Whenever you order, you ask to be delivered at 7:00PM, hoping to be
delivered no earlier than 6:30PM but no later than 7:30PM. These are your specifications
limits: LSL=6:30 and USL=7:30.
Over a year, you record the
delivery time for each of your orders and plot them into a histogram.
Obviously, you’ll want to calculate your mean to get the position of your data
set.

If we look at the mean, it seems
acceptable. Though, imagine getting your pizza delivered at 4PM (or even 9PM)
when asking it for 7… Let’s have a look at the spread of our data now. The
bell curve is not really sharp and we have already pointed out some outliers.
What we need to know is how far are our
data points from our central location. To get a real vision, we need to measure them all and compute a
mean.
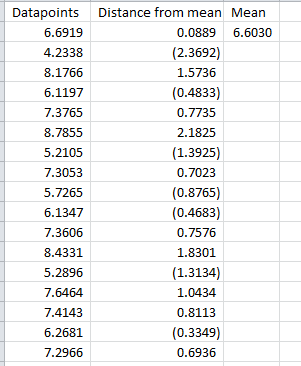
Our new concern is
that we have negative values now (everything on the left of the mean). Even if
sometimes we wish we had negative minutes, that is not going to happen anytime
soon.
Without going into too much
details, our best option to get absolute data (no negative sign) while
respecting mathematical rules, is to square our second column (as a reminder 1
x 1 = 1 and -1 x -1 = 1). This is what is called the variance.
Well, now we have square minutes
(and way much that the initial distance calculated). I would like a handful of
them every time I hit the snooze button of my alarm clock! But realistically,
this is as useful as negative minutes. So now if we take the square root of
this value, we get realistic minutes back.
Again, the standard deviation is
only the average distance between your data points and your mean. To get it, you
have to do a few mathematical pirouettes, but hopefully Excel, Minitab and
other statistical software will do it for you!
No comments:
Post a Comment